

On Tuesday (Dec. 5), spot gold continued to fall, narrowly missing the key support level of $2,010 to close at $2,019.42 as the dollar index rose to regain the 104 mark.
Fundamental analysis
Economic data released in the U.S. on Tuesday was mixed:
The U.S. ISM Services PMI came in at 52.7, exceeding market expectations and previous data;
U.S. JOLTS job openings fell by nearly 600,000 to 8.733 million in October, a figure well below the expected 9.35 million.
The above data further pushed the US dollar higher, with the dollar index regaining the 104 mark overnight.
Recently, despite the cooling of U.S. economic inflation and mixed signals from the labor market and economic activity, Fed policymakers on various occasions still expressed the possibility of not ruling out further policy tightening.
This slightly hawkish stance coincides with the release of key labor data this week, which could dramatically change market expectations if the data cooperates to show strength.
Thereby also forcing the gold long fervor due to the expected turn down in dollar interest rates to calm down, gold short-term or will also face the pressure of technical adjustment.
But so far this year, we observe that gold's rise is driven by two wheels. In addition to the rising investment boom, central banks reserve purchases of gold is also gradually become the catalyst for the rise of gold.
According to authoritative institutions statistics, in the year as of September, central banks net buy 800 tons of gold, a record for the same period.
The world gold association (WGC) a recent survey, 24% of the central bank intends to increase gold reserves in the next 12 months.
From the central banks of this active purchase of gold as a reserve action, its role in pushing up gold can not be underestimated.
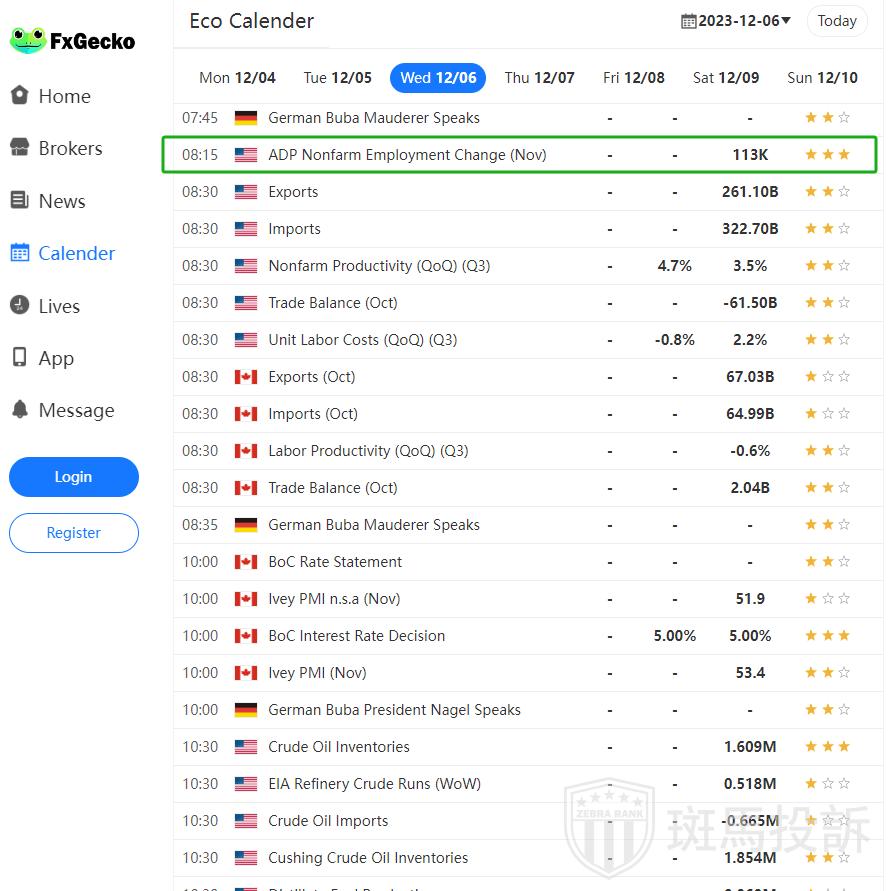
Investors next focus on:
the U.S. November ADP employment figures released on Wednesday;
the U.S. initial jobless claims released on Thursday;
the U.S. non-farm payrolls data released on Friday.
Technical Analysis
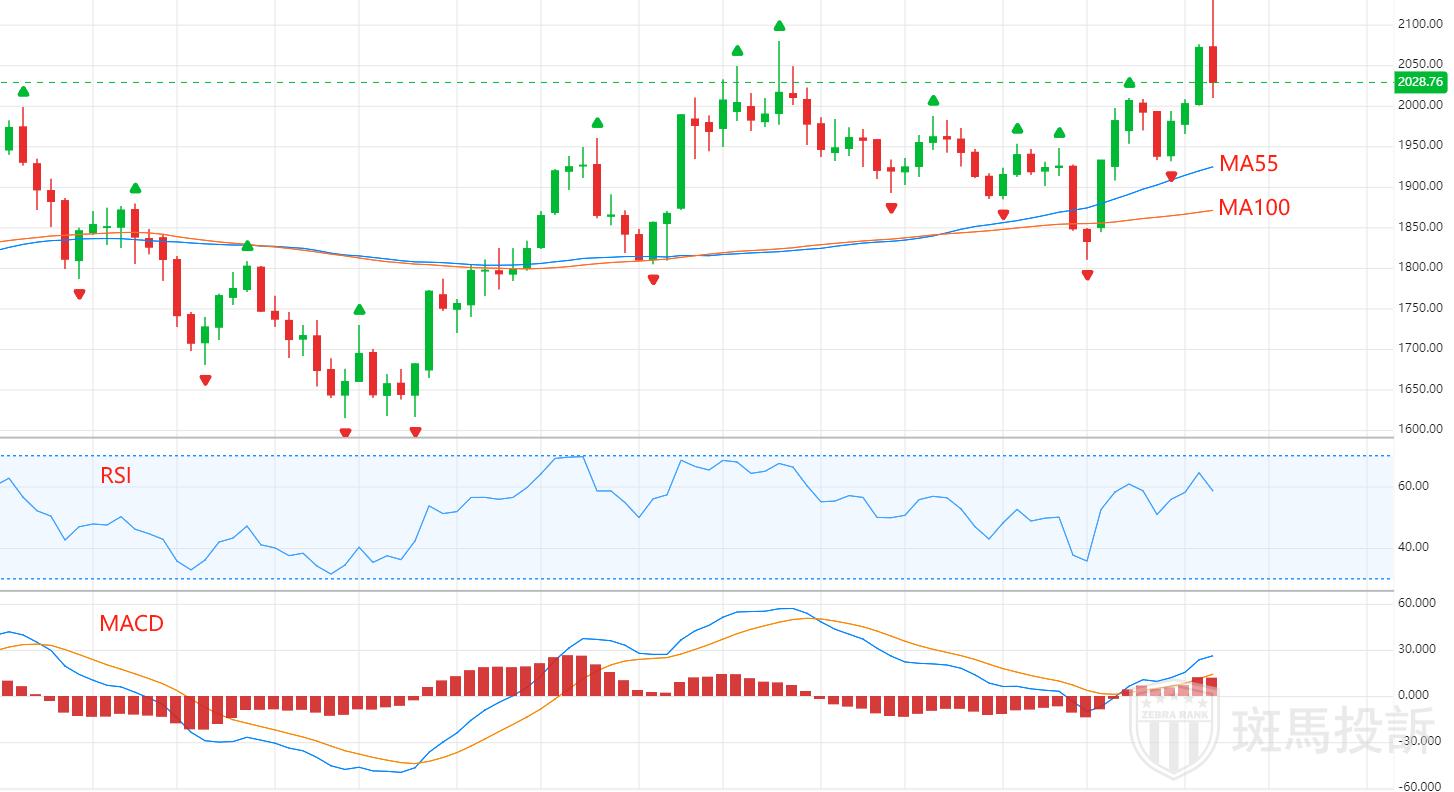
From a technical perspective, gold currently has strong short-term support near 2010-2000, which is likely to retrace further if broken.
If it stays above 2010, gold may stabilize with initial resistance at 2030.
In the medium term from the weekly chart, the RSI is in a positive mood, the 55-week moving average is crossing the 100-week moving average and both are rising and about to form a golden cross, all of which suggests that the overall trend in the gold price is still trending upwards.
However, bulls will need to see gold prices rise above 2050 to indicate that the short-term technical outlook may be improving. The high volatility in gold prices is expected to continue.
Support: 2010; 2000; 1985; 1970
Resistance: 2030; 2045; 2069; 2100
This is general market commentary and not investment advice.
