

Spot gold prices rose for the fourth consecutive trading day on Tuesday (November 28), and touched the highest level of more than six months 2042.79 U.S. dollars / ounce, closed at 2,041.55 U.S. dollars on the day, up 1.4% for the day.
On Tuesday, some dovish comments from Fed Governor Waller, who has long been considered a hawk, sparked an upward charge in gold.
Waller hinted at the possibility of a rate cut in the coming months if inflation continues to slide closer to the 2% target set by the Fed. This is because the continued slowing of the pace of price increases in recent periods will provide a rationale for an eventual rate cut.
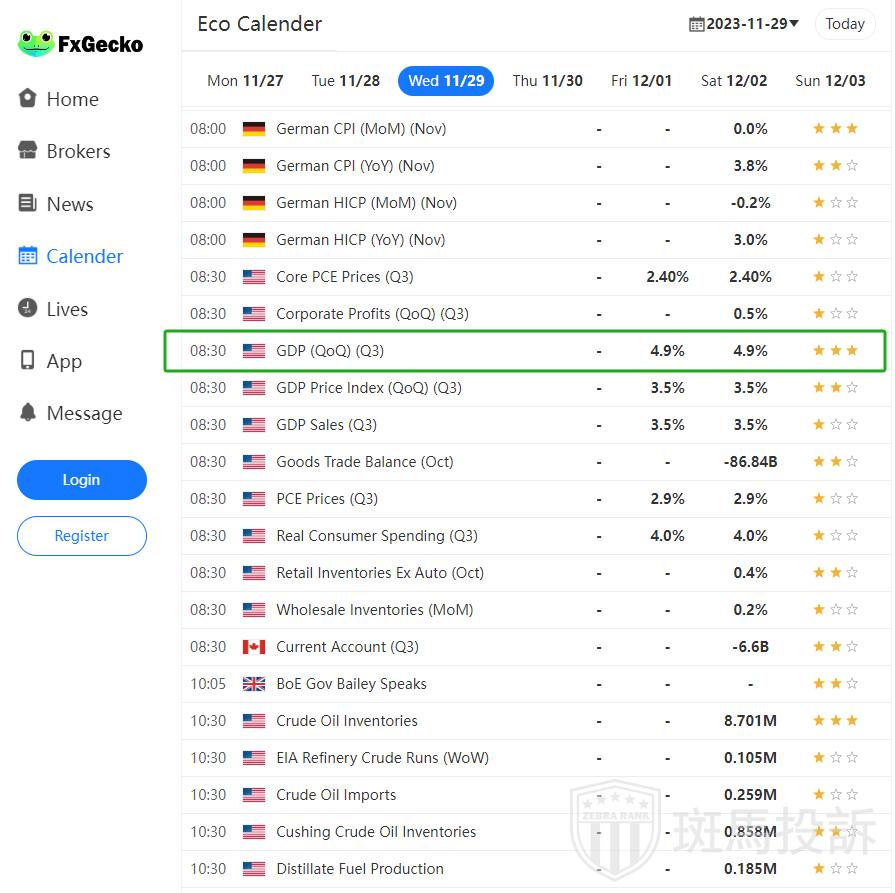
There is also third quarter US GDP and new inflation data PCE to be released this week. If the data really towards the Fed policymakers ideal expected direction, is bound to further increase the Fed's expectations of early rate cuts next year. And thereafter any signs of cooling of the U.S. economy will make the expected probability of rate cuts continue to increase. In this way, will further boost gold toward a higher level.
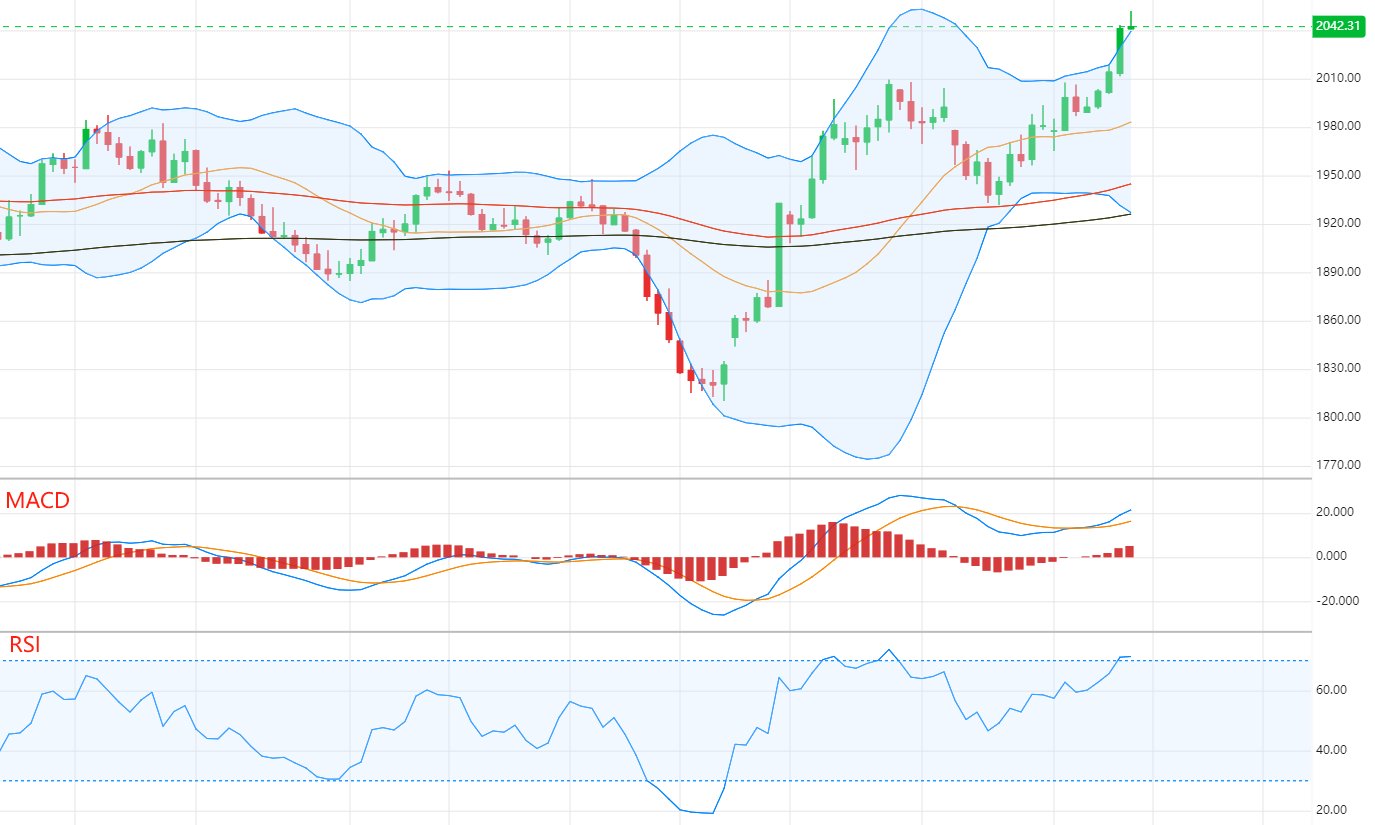
Technical analysis
On the daily chart of gold, the stochastic indicator has a golden cross, the Bollinger Band channel flare is in the midst of further expansion, and the Relative Strength Index RSI has entered the overbought region, indicating that gold momentum remains abundant.
Need to remind is that the next important U.S. data one after another, we must beware of data unexpectedly strong performance brought about by the risk of gold high profit-taking adjustment.
Key levels to watch for gold prices today:
Support: $2,021, $2,015, $2,000
Resistance: $2,069, $2,074
This is general market commentary and not investment advice.
