
Fundamental analysis
On Tuesday, the Federal Reserve released minutes, but the impact on the price of precious metals such as gold is not big, gold prices instead of taking the opportunity to pull up strongly.
The fed minutes show that all participants agreed that each meeting of the policy decision will continue to be based on "all the information synthesis"; all fed members believe that interest rates will remain restrictive for some time, and agreed to "caution" on the issue of interest rates. ".
The minutes did not produce unexpected more content, rather bland. At its core, it still did not exclude "another rate hike".
Nonetheless, since the meeting in early November, there have been increasing signs that the Fed may have reached a peak in interest rates.
First, U.S. bond yields, currently below the federal funds rate. This difference has spawned discussions about a possible easing of monetary policy in the near future.
Moreover, in addition to weak economic indicators, inflation fell more than expected in October.
Therefore, the minutes of the meeting is afraid that it is difficult to make the market expect the Fed will cut interest rates next year's point of view on this change.
After the release of the minutes of the Federal Reserve, CME "Fed Watch" data show that the Federal Reserve in December to maintain interest rates in the range of 5.25%-5.50% unchanged probability of 94.8%, the probability of raising interest rates by 25 basis points for 5.2%. This is perhaps quite where gold bulls feel reassured to continue buying gold.
Estimated that the market will continue to take the expected Fed rate shift this topic speculation gold. As for the Fed interest rate shift is expected to mood can not keep hot, everything will continue to keep a close eye on the U.S. economic data revealed by the development of the situation.
Technical Analysis
On the technical level, the daily chart of gold shows that supported by technical indicators, gold prices are biased to the upside. Momentum indicators break through the middle line, relative strength index (RSI) to move up, but still away from the overbought level. Continued short-term push higher will exacerbate the overbought performance of the technical indicators.
Currently gold prices in the 2007 U.S. dollars / ounce level near the composition of stronger resistance, the region in October to limit the upside space of gold prices. If it can be broken, gold is expected to continue to break higher. Otherwise, we must beware of the formation of a double top pattern turned down the risk.
Support: 1994 U.S. dollars / ounce; 1984 U.S. dollars / ounce; 1978 U.S. dollars / ounce
Resistance: 2010 U.S. dollars / ounce; 2023 U.S. dollars / ounce; 2029 U.S. dollars / ounce
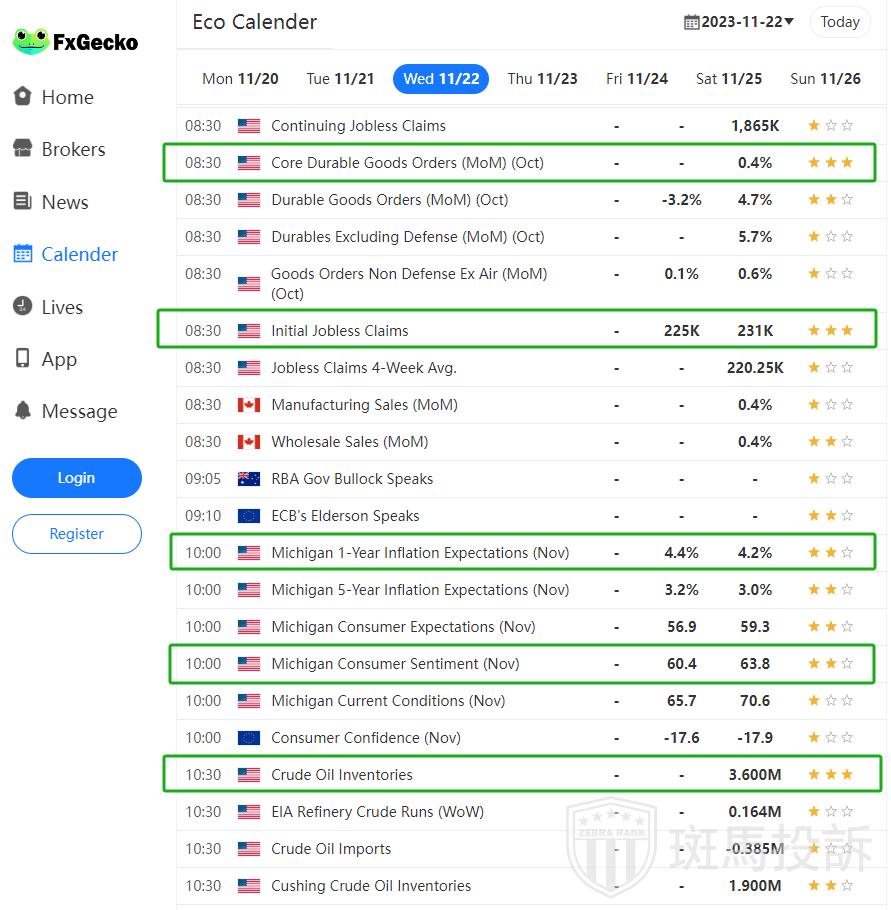
Today's Focus