

GBP / USD is testing key resistance areas in the daily chart.
Short sellers seek to continue the daily downward trend, with a target of 1.3340.
Sterling fell below the 1.35 mark against the US dollar in September last year, showing consolidation and daily chart resistance. At this juncture, if the daily chart resistance of sterling against the US dollar remains, the exchange rate will touch the 4-hour chart support, then fall below this level, continue to decline, and test the trend line support, as shown below:
GBP / USD, daily chart
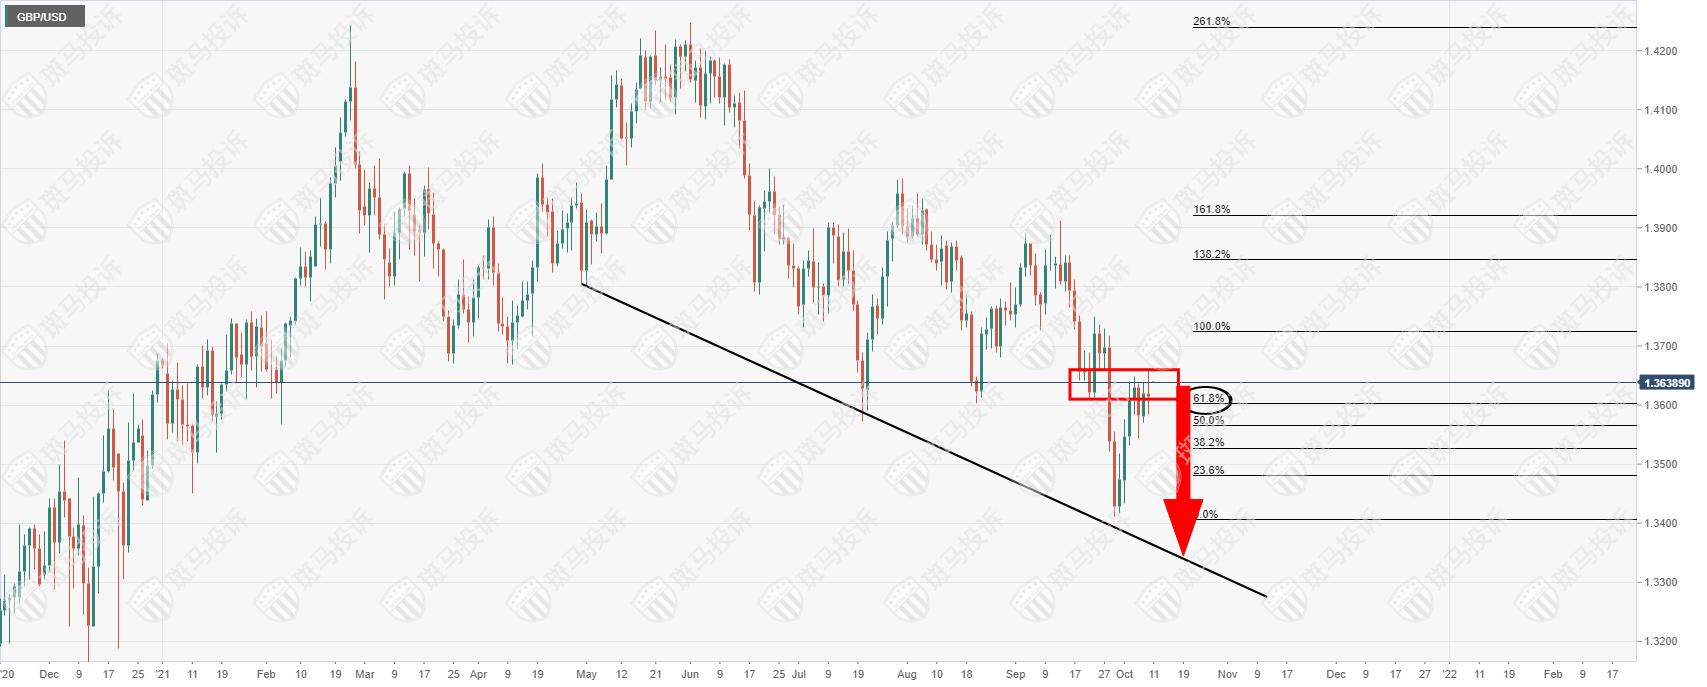
If GBPUSD does not break through 1.3660, it is still possible to retest the trend line support.
GBP / USD, 4-hour chart
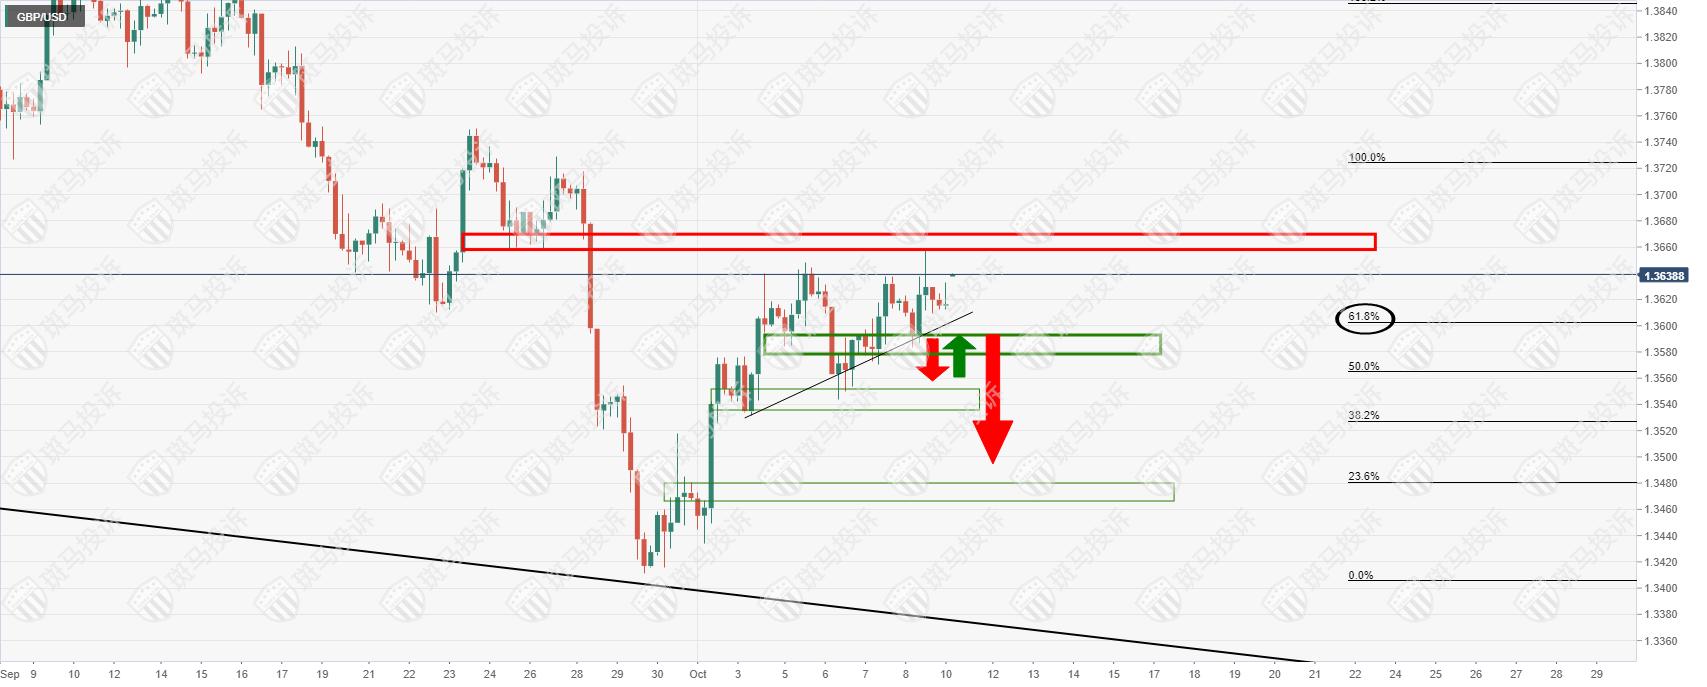
The 4-hour chart shows that the exchange rate remains above key support. Only when the exchange rate falls below the support level near 1.3580 will it have the opportunity to go down close to 1.3340. Foreign exchange platform recommendation: http://www.ban8.com.cn/platform/528.html
