

For the novice gold trader, mastering the right tools and platforms, as well as learning to use charts and indicators for gold market analysis is the key to achieving successful trading. This article will give you a brief overview of the essential trading tools and platforms and how to use charting techniques to gain insight into the gold market movements.
I. The choice of trading instruments and platforms
Before trading gold, you first need to choose the right trading tools and platform. The following are a few common choices:
1. Trading account: Choose a reliable broker to open a trading account and make sure it has a good reputation and regulatory license. Compare the fees, platform features and customer service of each broker to choose the account that best suits your needs.
PS: There are many brokerage companies, you can search on FxGecko APP to check their regulatory license and other qualification information, as well as customer reputation and risk tips to avoid unregulated, poor reputation and high risk brokers. If you encounter trading problems, you can also make complaints and expose scams on FxGecko APP!
2. Trading platform: Most brokers offer their own trading platforms, such as MetaTrader 4 (MT4) or MetaTrader 5 (MT5). These platforms offer features such as real-time quotes, trade order execution and analytical tools. Understand the platform's interface and functionality and familiarize yourself with the trading process.
3. Economic calendar and news feeds: The economic calendar provides a schedule of important economic data releases to help you predict market fluctuations. Also, follow reliable news feeds to keep up with global financial and geopolitical events in order to make informed trading decisions.

II. Learn charting analysis techniques
Chart analysis is an important technical analysis tool that can help you predict market trends by observing price movements and using various indicators. The following are a few commonly used chart types and indicators:
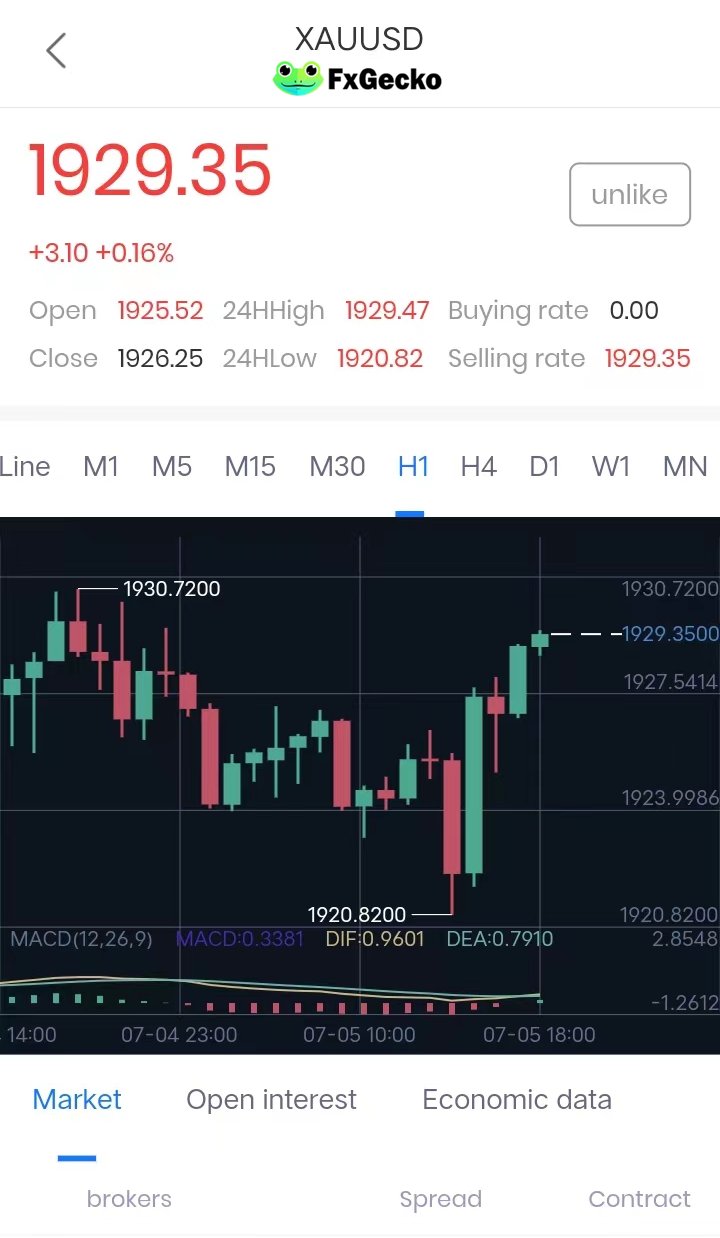
1. K-line charts (Candlestick Charts ): K-line charts are the most common type of chart to record price movements. Each K-line represents the opening, closing, highest and lowest prices over a period of time. By observing the patterns and formations of K-line charts, you can get an idea of market sentiment and trends.
2. Moving Averages: Moving averages are line indicators that smooth the price curve. It can help you identify long-term trends in prices. Commonly used moving averages include simple moving averages (SMA) and exponential moving averages (EMA).
3. Relative Strength Index (RSI): The RSI indicator measures the overbought and oversold levels of prices to determine if the market is overbought or sold. When the RSI exceeds a certain threshold, it may suggest an impending price reversal.
4. Bollinger bands: Bollinger bands are an indicator that contains a range of price fluctuations. It consists of a middle rail, an upper rail and a lower rail. A price reversal or continuation of a trend may occur when prices approach or break the boundaries of the Bollinger band.

III. Practicing and learning trading skills
In addition to mastering tools and analytical techniques, practice is the key to improving your trading skills. The following are a few suggestions:
1. Demo trading: Use a demo account for real-time trading to practice trading strategies, familiarize yourself with the operation of the trading platform, and evaluate the effectiveness of your strategies. In demo trading, you can observe the performance under different market conditions and gain real-world experience.
2. Learning resources: Read relevant trading books and articles, take online trading courses, join trading communities, and share your experience and learning with other traders. Get diversified learning resources to continuously improve your trading skills.
3. Risk management: Learning to manage risk effectively is the key to successful trading. Set reasonable stop-loss levels and profit-taking targets, and enforce them strictly. Don't put all your money into one trade, keep the position size moderate.

Mastering the tools and platforms needed to trade gold, as well as learning to use charts and indicators for analysis, is the basis for successful trading. Choose the right trading tools and platforms, become familiar with chart analysis techniques, and continue to improve through practice and study.
Remember that trading is a process of learning and development, stay patient and persistent and you will gradually master the skills of gold trading and achieve long-term profitability. May you succeed on the path of gold trading!
Click here for more gold trading beginner's guide articles:
What are the major currencies to look for when trading gold?
PS: You can view more gold market information, data charts in FxGecko app. You can also use FxGecko app to check the information of brokers around the world, and you can directly submit complaints for help when you encounter problems.
【Reminder】Investment is risky, decision-making needs to be careful. This article only represents the author's own views, for reference only, does not constitute any investment advice.